Key Takeaways
• Height-weight correlation: An ideal body weight calculator uses validated formulas (Devine, Robinson, Miller) that start at 5 feet and add weight per inch based on gender
• BMI limitations: 30% of individuals classified as "normal weight" by BMI may have excess body fat (normal weight obesity) per
Mayo Clinic Proceedings research
• Regional risk factors: Indians develop type 2 diabetes at a 5-10 years younger age and lower BMI compared to Western populations
• Beyond BMI: Waist circumference >90 cm (men) or >80 cm (women) indicates central obesity risk in South Asians, regardless of BMI
What is Ideal Body Weight?
Ideal body weight refers to a medically recommended weight range based on height and gender that minimises disease risk and optimises long-term health outcomes.
Research demonstrates that maintaining weight according to height within optimal ranges reduces all-cause mortality by 23-47% compared to obesity.
This is not about cosmetic appearance or achieving a so-called "perfect body measurement." Instead, it reflects the safest metabolic range associated with:
- 34% lower risk of type 2 diabetes
- Reduced cardiovascular mortality by up to 41%
- Lower rates of fatty liver disease, joint problems, and certain cancers
- Improved fertility and surgical outcomes
How Doctors Calculate Weight According to Height
An ideal body weight calculator uses clinically validated formulas to determine weight as per height and age. Here are the four most recognized methods:
Medical Formulas for Height Wise Weight Calculator
Devine Formula (1974) - Most widely used in clinical practice
- Men: 50 kg + 2.3 kg per inch above 5 feet
- Women: 45.5 kg + 2.3 kg per inch above 5 feet
Robinson Formula (1983) - Used for dosing calculations
- Men: 52 kg + 1.9 kg per inch above 5 feet
- Women: 49 kg + 1.7 kg per inch above 5 feet
Miller Formula (1983) - Alternative clinical standard
- Men: 56.2 kg + 1.41 kg per inch above 5 feet
- Women: 53.1 kg + 1.36 kg per inch above 5 feet
Hamwi Formula (1964) - Traditional medical formula
- Men: 48 kg + 2.7 kg per inch above 5 feet
- Women: 45.5 kg + 2.2 kg per inch above 5 feet
These formulas form the foundation of a perfect weight calculator and weight calculator according to height and age used in hospitals and research institutions globally.
Does Age Matter in Weight Calculation?
Height remains the primary determinant for calculating baseline healthy weight.
However, age influences:
- Metabolic rate: Declines 1-2% per decade after age 30
- Muscle mass loss: 3-8% per decade after age 30 (sarcopenia)
- Fat redistribution: Increased visceral adiposity with aging
- Bone density changes: Affects overall body composition
Height and Weight Chart for Men and Women
Height and Weight Chart for Men
The height and weight chart for men accounts for higher muscle mass distribution (42% vs 36% in women) and a broader skeletal frame.
5'0" (152 cm)
- Minimum Healthy Weight: 95 lbs (43 kg)
- Maximum Healthy Weight: 128 lbs (58 kg)
- Ideal Range (BMI 18.5-24.9): 43-58 kg
5'2" (157 cm)
- Minimum Healthy Weight: 104 lbs (47 kg)
- Maximum Healthy Weight: 141 lbs (64 kg)
- Ideal Range: 47-64 kg
5'4" (163 cm)
- Minimum Healthy Weight: 114 lbs (52 kg)
- Maximum Healthy Weight: 155 lbs (70 kg)
- Ideal Range: 52-70 kg
5'6" (168 cm)
- Minimum Healthy Weight: 124 lbs (56 kg)
- Maximum Healthy Weight: 168 lbs (76 kg)
- Ideal Range: 56-76 kg
5'8" (173 cm)
- Minimum Healthy Weight: 134 lbs (61 kg)
- Maximum Healthy Weight: 182 lbs (83 kg)
- Ideal Range: 61-83 kg
5'10" (178 cm)
- Minimum Healthy Weight: 144 lbs (65 kg)
- Maximum Healthy Weight: 196 lbs (89 kg)
- Ideal Range: 65-89 kg
6'0" (183 cm)
- Minimum Healthy Weight: 154 lbs (70 kg)
- Maximum Healthy Weight: 210 lbs (95 kg)
- Ideal Range: 70-95 kg
6'2" (188 cm)
- Minimum Healthy Weight: 165 lbs (75 kg)
- Maximum Healthy Weight: 225 lbs (102 kg)
- Ideal Range: 75-102 kg
6'4" (193 cm)
- Minimum Healthy Weight: 176 lbs (80 kg)
- Maximum Healthy Weight: 240 lbs (109 kg)
- Ideal Range: 80-109 kg
Height Weight Chart Female
4'10" (147 cm)
- Minimum Healthy Weight: 86 lbs (39 kg)
- Maximum Healthy Weight: 116 lbs (53 kg)
- Ideal Range: 39-53 kg
5'0" (152 cm)
- Minimum Healthy Weight: 95 lbs (43 kg)
- Maximum Healthy Weight: 128 lbs (58 kg)
- Ideal Range: 43-58 kg
5'2" (157 cm)
- Minimum Healthy Weight: 104 lbs (47 kg)
- Maximum Healthy Weight: 141 lbs (64 kg)
- Ideal Range: 47-64 kg
5'4" (163 cm)
- Minimum Healthy Weight: 114 lbs (52 kg)
- Maximum Healthy Weight: 155 lbs (70 kg)
- Ideal Range: 52-70 kg
5'6" (168 cm)
- Minimum Healthy Weight: 124 lbs (56 kg)
- Maximum Healthy Weight: 168 lbs (76 kg)
- Ideal Range: 56-76 kg
5'8" (173 cm)
- Minimum Healthy Weight: 134 lbs (61 kg)
- Maximum Healthy Weight: 182 lbs (83 kg)
- Ideal Range: 61-83 kg
5'10" (178 cm)
- Minimum Healthy Weight: 144 lbs (65 kg)
- Maximum Healthy Weight: 196 lbs (89 kg)
- Ideal Range: 65-89 kg
6'0" (183 cm)
- Minimum Healthy Weight: 154 lbs (70 kg)
- Maximum Healthy Weight: 210 lbs (95 kg)
- Ideal Range: 70-95 kg
Note: Women naturally carry 6-11% more essential body fat than men due to reproductive function
When interpreted correctly, an according to height weight chart helps categorize individuals into underweight, healthy range, overweight, or obese categories. However, charts alone are screening tools, not final medical conclusions.
Understanding BMI: Definition, Calculation & Ranges
What is BMI?
Body Mass Index (BMI) is a screening measurement that relates body weight to height to estimate total body fat and classify weight-related health risk.
The BMI definition was developed by Belgian mathematician Adolphe Quetelet in 1832 and has been used as a clinical screening tool since the 1970s.
How to Calculate BMI (Formula)
BMI Formula (Metric System):
BMI = Weight (kg) ÷ [Height (m)]²
BMI Formula (Imperial System):
BMI = [Weight (lbs) ÷ Height (inches)²] × 703
How to Check Your BMI (Step-by-Step)
Here's the complete answer:
- Measure your weight in kilograms (or pounds)
- Measure your height in meters (or inches)
- Apply the formula: Divide weight by height squared
- Compare to standard ranges (see below)
Example Calculation:
- Weight: 70 kg
- Height: 1.75 m (175 cm)
- Calculation: 70 ÷ (1.75 × 1.75) = 70 ÷ 3.0625 = 22.86
- Result: Falls within normal BMI range
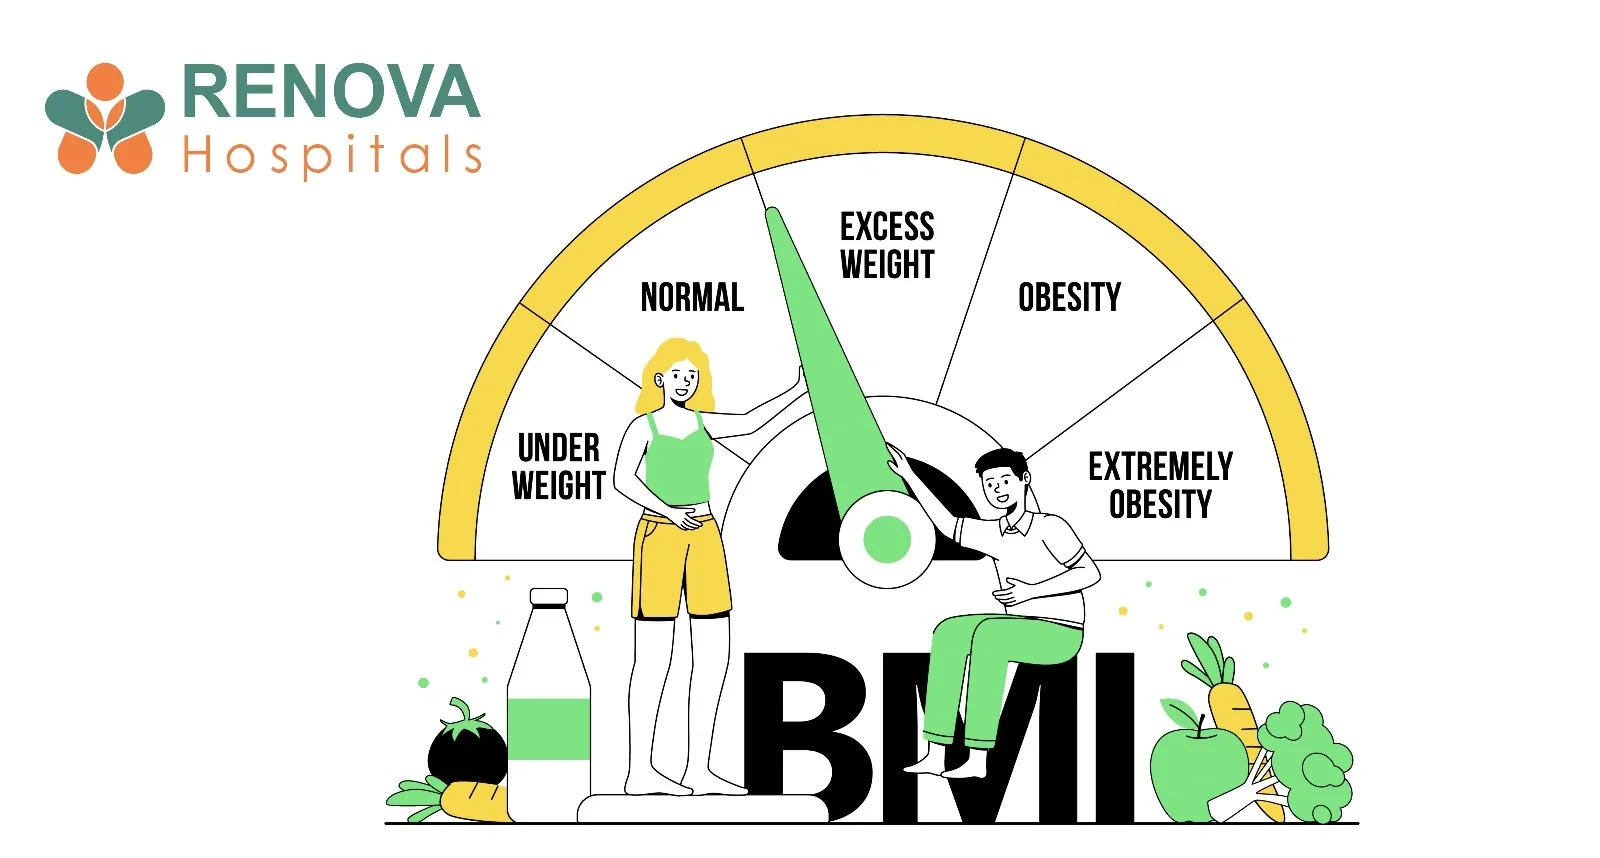
BMI Ranges: What Do the Numbers Mean?
Standard BMI ranges for adults, as defined by the World Health Organisation:
Underweight
- BMI Range: Below 18.5 kg/m²
- Health Risk Level: Malnutrition, osteoporosis risk
- Population Prevalence: 9.1% globally
Normal BMI Range
- BMI Range: 18.5 – 24.9 kg/m²
- Health Risk Level: Lowest disease risk
- Population Prevalence: 37.8% globally
Overweight
- BMI Range: 25 – 29.9 kg/m²
- Health Risk Level: Moderate risk
- Population Prevalence: 39.1% globally
Obese (Class I)
- BMI Range: 30 – 34.9 kg/m²
- Health Risk Level: High risk
- Population Prevalence: 13% globally
Obese (Class II)
- BMI Range: 35 – 39.9 kg/m²
- Health Risk Level: Very high risk
Obese (Class III)
- BMI Range: 40 and above kg/m²
- Health Risk Level: Extremely high risk
The normal BMI range (18.5–24.9) is often referred to as the healthy BMI range and is associated with the lowest all-cause mortality risk.
Modified BMI Ranges for South Asian Populations
Recommended BMI Cutoffs for South Asians:
Underweight
- Standard BMI: <18.5
- Asian-Specific BMI: <18.5
- Risk Level: Unchanged
Normal
- Standard BMI: 18.5-24.9
- Asian-Specific BMI: 18.5-22.9
- Risk Level: Lower threshold
Overweight
- Standard BMI: 25-29.9
- Asian-Specific BMI: 23-27.4
- Risk Level: Action point reduced
Obese
- Standard BMI: ≥30
- Asian-Specific BMI: ≥27.5
- Risk Level: Earlier intervention
Why this matters: Studies show Indians develop diabetes at a BMI of 23-25, compared to a BMI of 30+ in Western populations
What Does "Perfect Body Measurement" Really Mean?
There is no universal "perfect body measurement" from a medical perspective. Health is not defined by aesthetics, social media standards, or fashion industry ideals.
Evidence-Based Health Markers (Beyond BMI)
1. Waist-to-Hip Ratio (WHR)
2. Waist Circumference (Central Obesity Indicator)
3. Body Fat Percentage
4. Muscle Mass Distribution
At Renova Hospitals, we evaluate beyond numbers using comprehensive body composition analysis.
Health Risks of Being Underweight
Being below recommended weight according to height may lead to serious health complications:
Medical Consequences of Low BMI
- Malnutrition: Vitamin deficiencies, anemia, weakened immune function
- Osteoporosis: Up to 39% higher fracture risk
- Hormonal imbalance: Amenorrhea, infertility, low testosterone
- Surgical complications: 12% increased mortality in surgical patients
- Cardiovascular issues: Arrhythmias, weakened heart muscle
- Psychological effects: Higher depression and anxiety rates
For pregnant women: Underweight increases risk of preterm birth by 29%
Underweight status requires clinical evaluation, not self-diagnosis.
Health Risks of Being Overweight or Obese
When BMI enters overweight or obese categories (≥25 kg/m²), health risks increase exponentially, backed by extensive research:
Disease Risk by BMI Category
- Type 2 Diabetes
- HypertensionIdealBMI
- Heart Disease
- Stroke
- Sleep Apnea
- Certain Cancers
Why Excess Weight is Dangerous
Visceral fat (belly fat) drives chronic inflammation, the root cause of multiple lifestyle diseases:
- Releases pro-inflammatory cytokines (TNF-α, IL-6)
- Increases insulin resistance by 40-60%
- Elevates blood pressure through renin-angiotensin activation
- Promotes arterial plaque formation (atherosclerosis)
Research shows: Every 5-unit BMI increase above 25 kg/m² raises mortality risk by 31%.
Critical Limitations of BMI
While BMI is a useful screening tool adopted by the
CDC and WHO, it has well-documented limitations:
5 Major BMI Limitations
1. Does not measure body composition
- Athletes with high muscle mass may be classified as "overweight"
- Example: Olympic weightlifters often have a BMI >30 but <8% body fat
2. Underestimates risk in the elderly
- Age-related muscle loss (sarcopenia) masks fat gain
- Research found 45% of the elderly with normal BMI had sarcopenic obesity
3. Ignores fat distribution
- Visceral fat (dangerous) vs. subcutaneous fat (less harmful)
- Two people with a BMI of 28 may have vastly different health risks
4. Not ethnicity-adjusted in standard use
- South Asians develop diabetes at a BMI of 23-25
- Polynesians may have higher healthy BMI thresholds
5. Cannot replace clinical evaluation
- Doesn't account for medical history, genetics, lifestyle factors
- Must be combined with waist circumference, blood tests, and blood pressure
Bottom line: BMI is a starting point, not a diagnostic conclusion. Clinical assessment requires multiple parameters.
Achieving and Maintaining a Healthy Weight: Evidence-Based Strategies
Sustainable weight management requires a medical, not cosmetic, approach. Here's what research shows actually works:
1. Balanced Nutrition
Proven dietary patterns:
- Mediterranean Diet: Reduces cardiovascular events by 30%
- DASH Diet: Lowers systolic BP by 11 mm Hg
- High-protein diets: Preserve lean mass during weight loss
Key principles:
- Whole foods: vegetables, fruits, whole grains, legumes
- Lean protein: 1.2-1.6 g/kg body weight daily
- Healthy fats: omega-3s, nuts, olive oil
- Fibre: 25-35 g daily (reduces hunger, stabilises blood sugar)
- Portion control: 500-750 calorie daily deficit for 0.5-1 kg loss per week
2. Regular Exercise
Minimum recommendations from the WHO Physical Activity Guidelines:
- 150-300 minutes of moderate-intensity aerobic activity weekly
- Resistance training 2-3 days per week
- Combined approach most effective: cardio + strength training
Research findings:
- Exercise alone: 2-3 kg weight loss
- Exercise + diet: 8-11 kg weight loss
- Resistance training: Preserves muscle mass, boosts metabolism
3. Lifestyle Optimization
Sleep:
- 7-9 hours nightly
- Sleep deprivation increases obesity risk by 55%
Stress Management:
- Chronic cortisol elevation promotes abdominal fat storage
- Mindfulness reduces stress eating by 30%
Behavioral factors:
- Quit smoking
- Limit alcohol (<14 units/week)
- Regular meal timing
- Mindful eating practices
Measure. Interpret. Act Early.
Calculating your BMI and checking a height weight chart are only the first steps. True prevention requires clinical interpretation, waist measurement, and metabolic screening, especially if BMI is ≥23 for South Asians. Early, comprehensive assessment at Renova Hospitals helps detect risk sooner and prevent long-term complications.
At Renova Hospitals, we move beyond basic BMI charts by integrating ethnicity-adjusted BMI cutoffs for South Asians, waist circumference screening, advanced body composition analysis (DEXA, bioimpedance), metabolic testing (HbA1c, lipid profile, liver function), and structured cardiovascular risk assessment. Every evaluation is physician-led, ensuring accurate interpretation and sustainable lifestyle guidance tailored to Indian populations.
Medical Disclaimer: This guide is for educational purposes only and does not constitute medical advice. An individual health assessment requires an in-person clinical evaluation. Always consult qualified healthcare professionals before making significant changes to diet, exercise, or lifestyle. BMI and weight calculations are screening tools that must be interpreted alongside comprehensive medical history, physical examination, and diagnostic testing.